
In the age of Digital Transformation, companies should benefit from using Machine Learning (ML) techniques to improve their processes. A lot is said about how the computer can learn and infer new information from previous observations. But how does the journey from Data to Value work? This article aims to clarify how we can use data science for insights finding at your organization, overcoming the challenges of real-world data to generate value and improve processes.
Machine Learning (ML) can deliver value to your corporation. We all have heard this sentence repeatedly. In the age of Digital Transformation and AI driven work, it is impossible to be unaware of the benefits of implementing ML in your organization. But how can we use data science to gain insight into our data? And, most importantly, how can we leverage all the business knowledge from the most experienced business experts to support ML in this Data to Value journey?
Data is key, but business is essential
With ML we can use historical information to make inferences about the future, generalizing the solutions of a problem. However, it is important to remember that ML is not a magic tool and that good data quality is vital for this process of inference and generalization. If our data does not reflect the reality of the business, our models cannot learn how to generalize a solution to it. There is a lot to talk about data quality and what is good data, which is beyond the scope of this post and can be published in a separate blogpost. The point I would like to stress here is that ML is supposed to support your business, which has held all your processes together long before the buzz of AI. That being said, no one knows better than your business experts about challenges in the business that can be solved using ML and AI. Their knowledge and experience are essential to gain insights from your data.
Feature construction is the bridge between business and ML
But how can we translate our best expert ‘s knowledge to a language that machines can understand? This is where the feature construction plays an important role. Let’s say that we aim to reduce delays during a production planning. For doing so we want to set standard times for a process according to factors commonly causing delays on the production. We decide to use ML for discovering the most common causes of delays. In constant communication with the planner responsible for setting the standard time of a process, we learned that new machines (less than 3 months old) can take more time on each process due to the lack of experience of the employees with the machine setup. On the other hand, old machines (older than 5 years old) can also be slower than the average due to newer technologies being used in newer models. Having this information, we can use feature construction to enrich our ML model with expert’s knowledge. As we want to predict the delays, we also need to calculate it based on the difference between standard and confirmed time. In feature notation, we have something like this:  Since we want to find the most common causes to delay, we also need to consider other possible reasons for a process to be delayed. In statistical language, these are the hypothesis that we would like to confirm using a ML model. In further discussing with the planner responsible for the production, we decided that the most common causes of delay are:
- Machine’s age (too new or too old): as we have already mentioned, new machines are hard to setup and old ones have outdated hardware.
- Seasonality driven increase on demand: production planning is always trying it’s best to meet the demand. An increased demand also increases the runtimes, which generates delays.
- Lack of employees working on a certain day: like the increase on demand, lack of employees causes the overload on the employees working in a certain day and delays on production.
- Machine’s breakdown: unexpected breakdowns on the machines causes overload on the working machines and delays on production of affected materials.
- People skills: the time that an employee has been with the company is a good indicator of how experienced he/she is. The more experienced an employee, the faster he/she is. This is a good indicator for delays, however (due to data protection) this information is usually not available and therefore will not be considered on this article.
Translating all these reasons to ML notation, we get the following feature matrix: 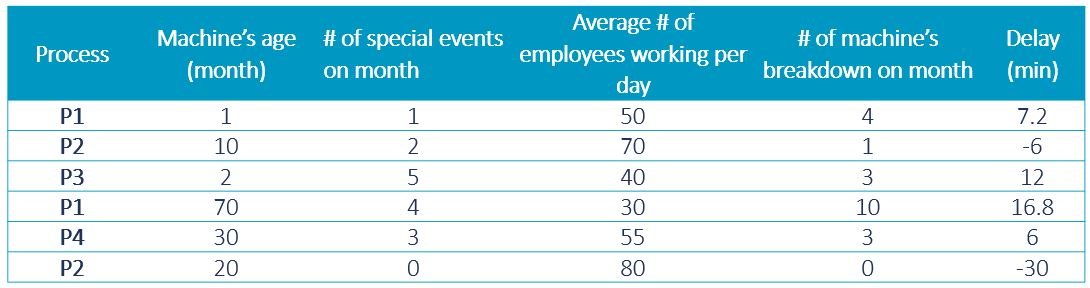 With our feature matrix in hand, we can work on the analysis of the most common delay causes.
Feature importance: the first step into causality analysis
On tree-based ML algorithms like random forests or decision trees, feature importance is a measure that indicates how relevant a certain feature is for your model. Mathematically speaking, it calculates how much better your predictions get with each new node on your decision tree and weights it by the probability of reaching that node. The higher the value, the more important your feature is. This measure can be very useful for our causality analysis. We want to find the most common causes for our production delays. We have already defined our hypothesis together with our business specialist and the hypothesis were already transformed to our feature matrix. So now we can use this information to predict the delay. It is important to remember that our final goal is to setup better standard times to avoid these delays. However, predicting them will help us finding their drives and this information will be used for setting up the new standard times. Let’s look possible feature importance generated by running a random forest model on our dataset: 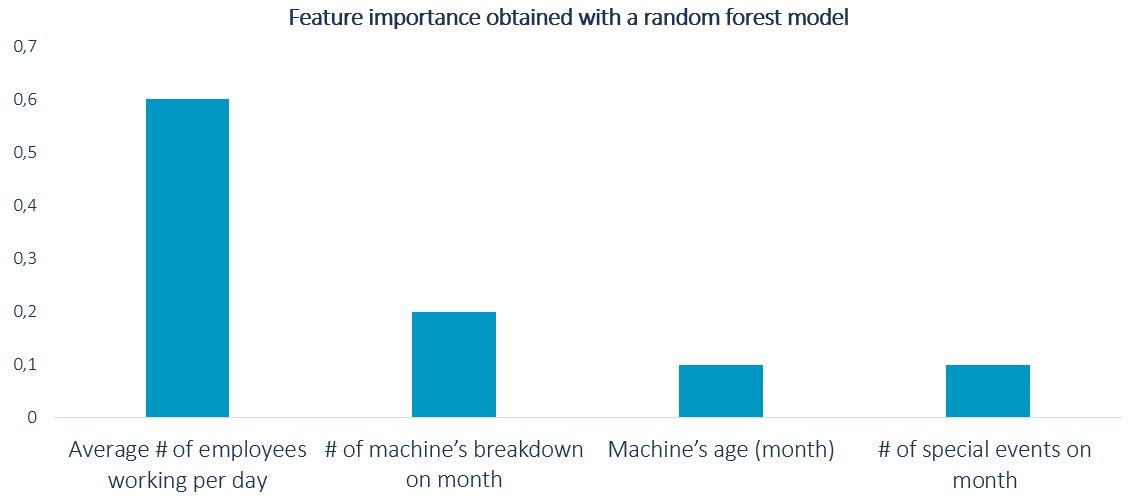 With the graph we can see that the average number of employees working per day on a month is the most relevant predictor for the delay. That means that the standard production times should be mainly driven according to the availability of workforce on that month. We can also see that the number of machine breakdowns on the month is an important factor. That indicates that unexpected maintenance can be very expensive for the production. One way to reduce this cost would be to start a predictive maintenance project, another very popular use case for ML that can help us improving our business processes.
A fast Return of Investment (ROI) comes with the understanding of Machine Learning, its strengths and limitations
As we can see, ML is a powerful but also complex tool. Only the understanding of its strengths and limitations can help us achieve a fast ROI. To transform Data to Value, we need to remember that ML / AI / Data Science / Deep Learning and all the other buzzwords of the moment are nothing more than tools that can support us on our journey. Business is, and it should be, the main driver for our work. The correct translation of business requirements into data (or features) for our models is the way to find the root cause of the events we analyze. Mathematical concepts like feature importance of the coefficients of a regression can support us on the quantification of our causation analysis and the correct interpretation of the results allows us to improve our business and generate value with ML.
We would like to thank Maíra Ladeira Tanke and Frank Kienle for their contribution to this article.