
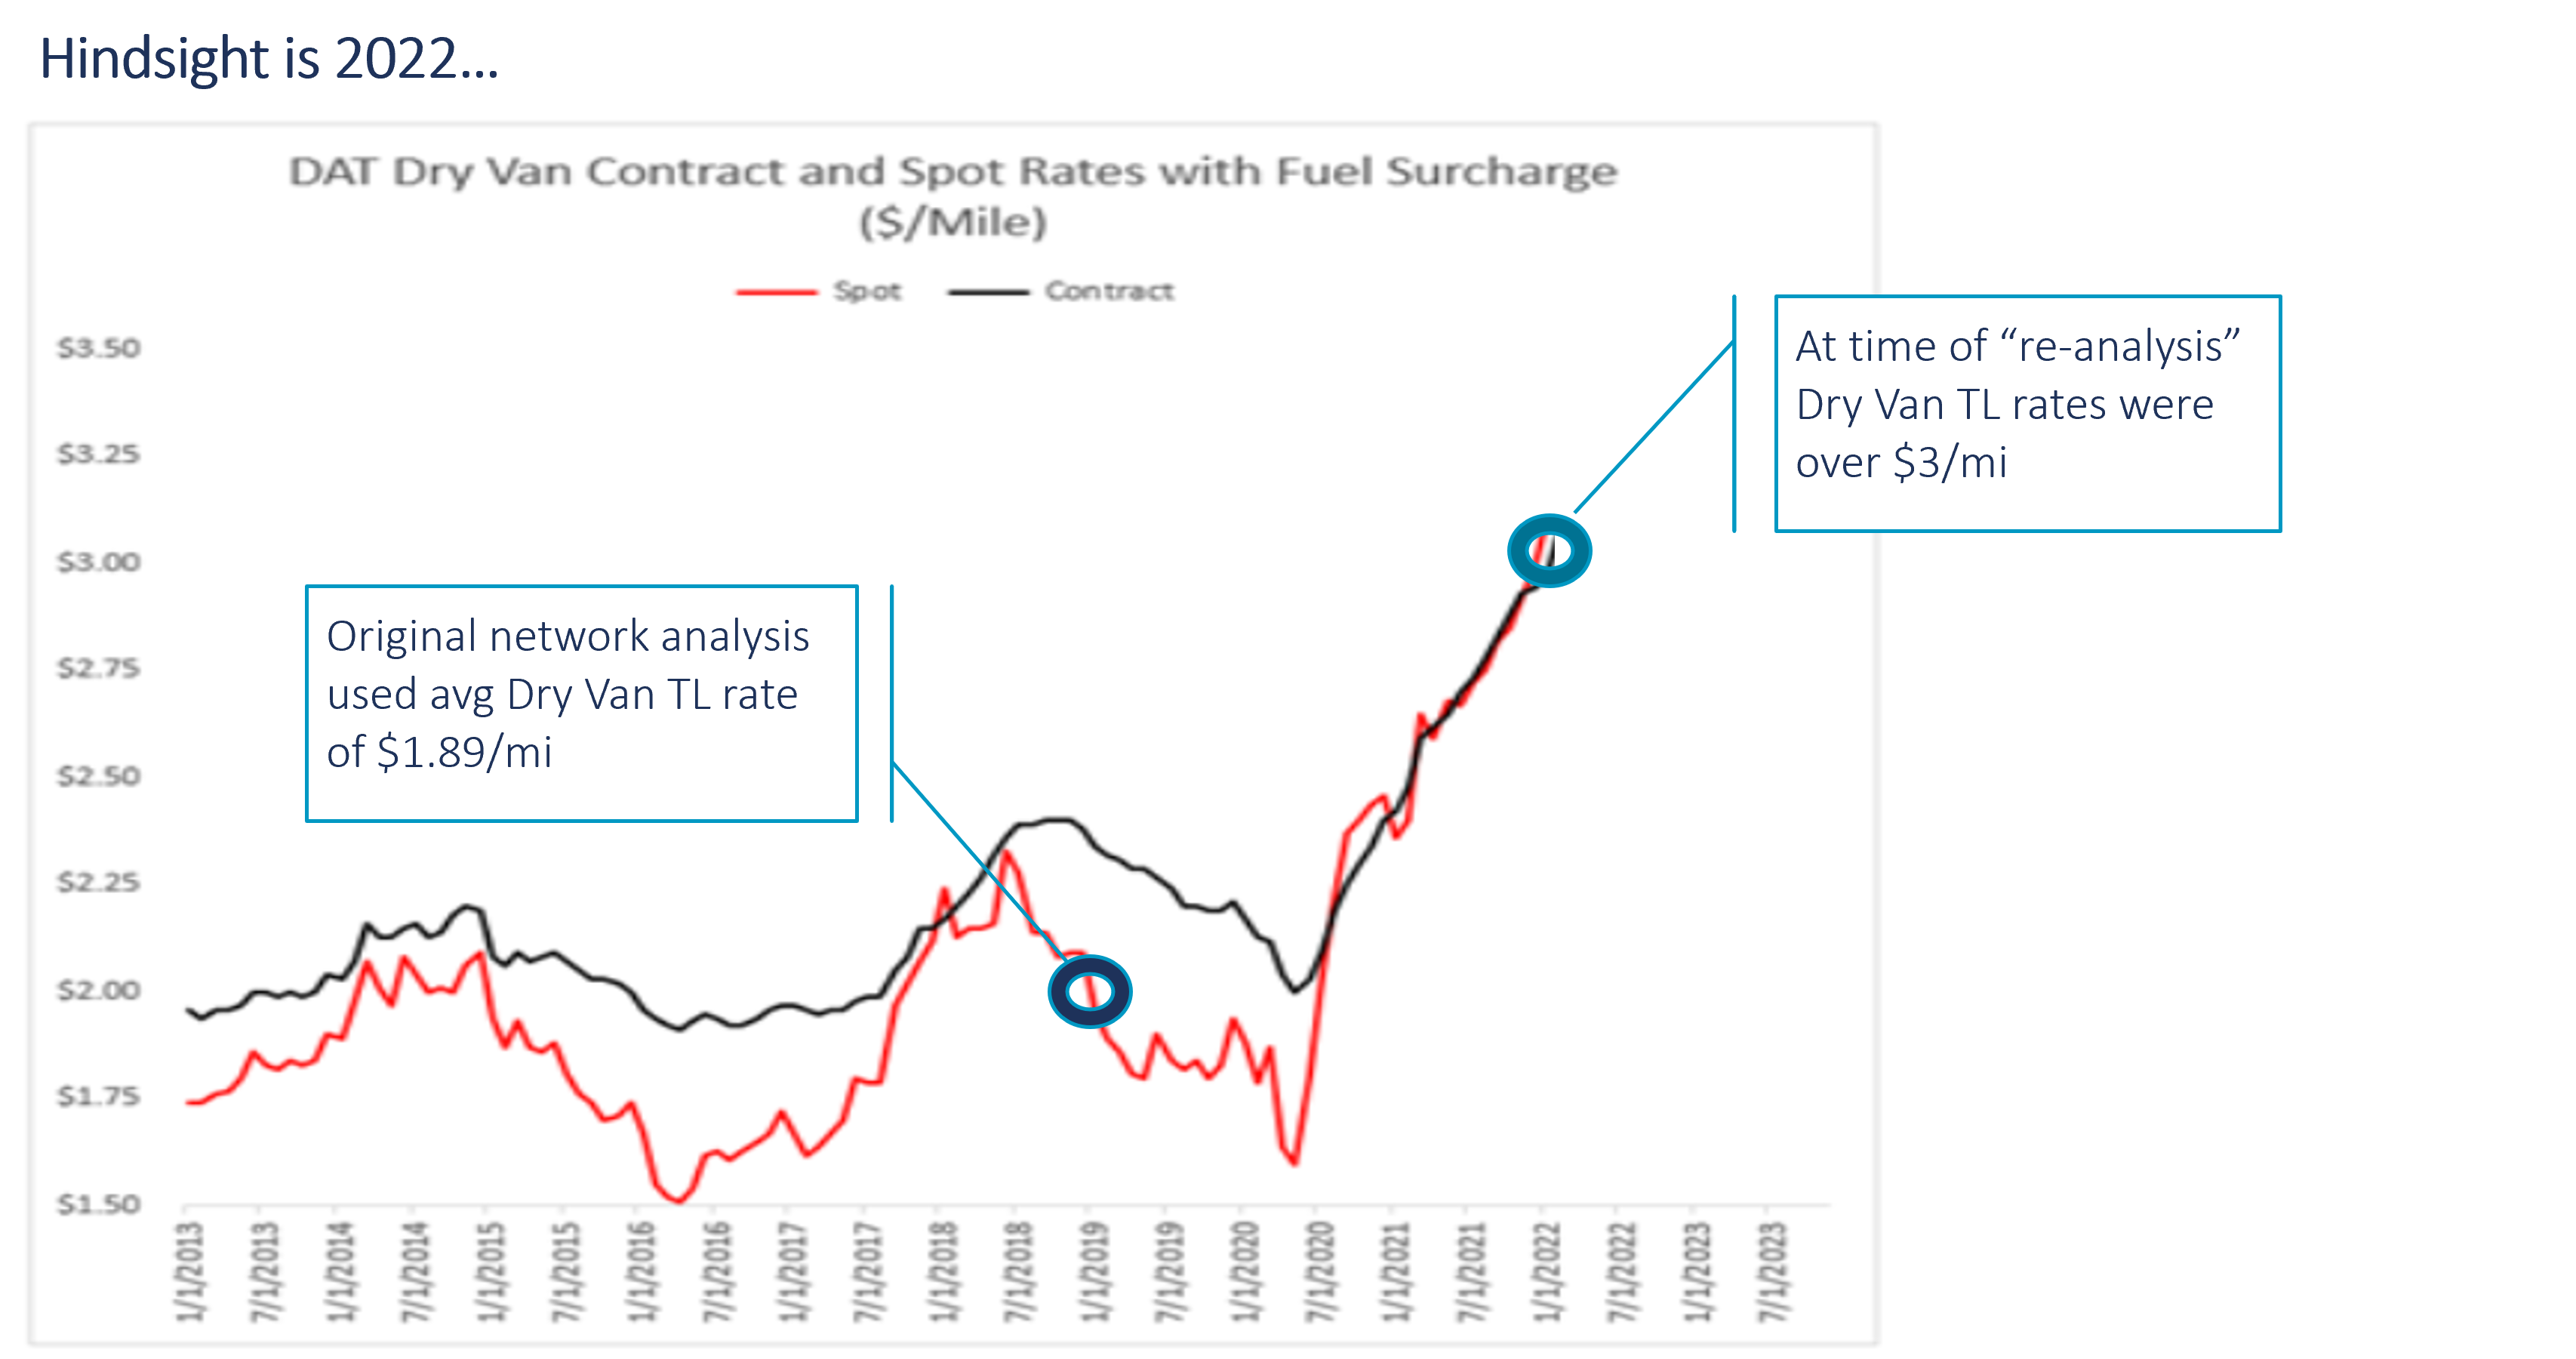
Coming out of the pandemic in November of 2021, a mid-market consumer company entrusted CAMELOT with the validation of a supply chain network design analysis performed just months prior to the start of the pandemic in March of 2020. To no surprise, the COVID-19 pandemic made the plan to execute the network analysis essentially worthless. The realities of contract expirations, organic growth, and new products, however, did not make capacity constraints go away. Was opening the new east coast warehouse still the right move?
Oversimplifying the nuances, a re-analysis of the network did not justify a new east coast warehouse as the then current $3.05-mile average truck load was over 60% more than the average rate which was used in the initial analysis. The re-analysis boiled down to two questions:
- At what rate does the new east coast warehouse make sense?
- When might the Dry Van Full Truckload (FTL) market get there?
The first question was just math. The second question was anybody’s guess.
The original network design project did include a sensitivity analysis representing 15% to 20% variances in important assumptions – a 60% variance never made the radar screen. The planning process took center stage as the COVID-19 pandemic made the plan itself obsolete.
Predicting the Development of Truckload Freight Rates
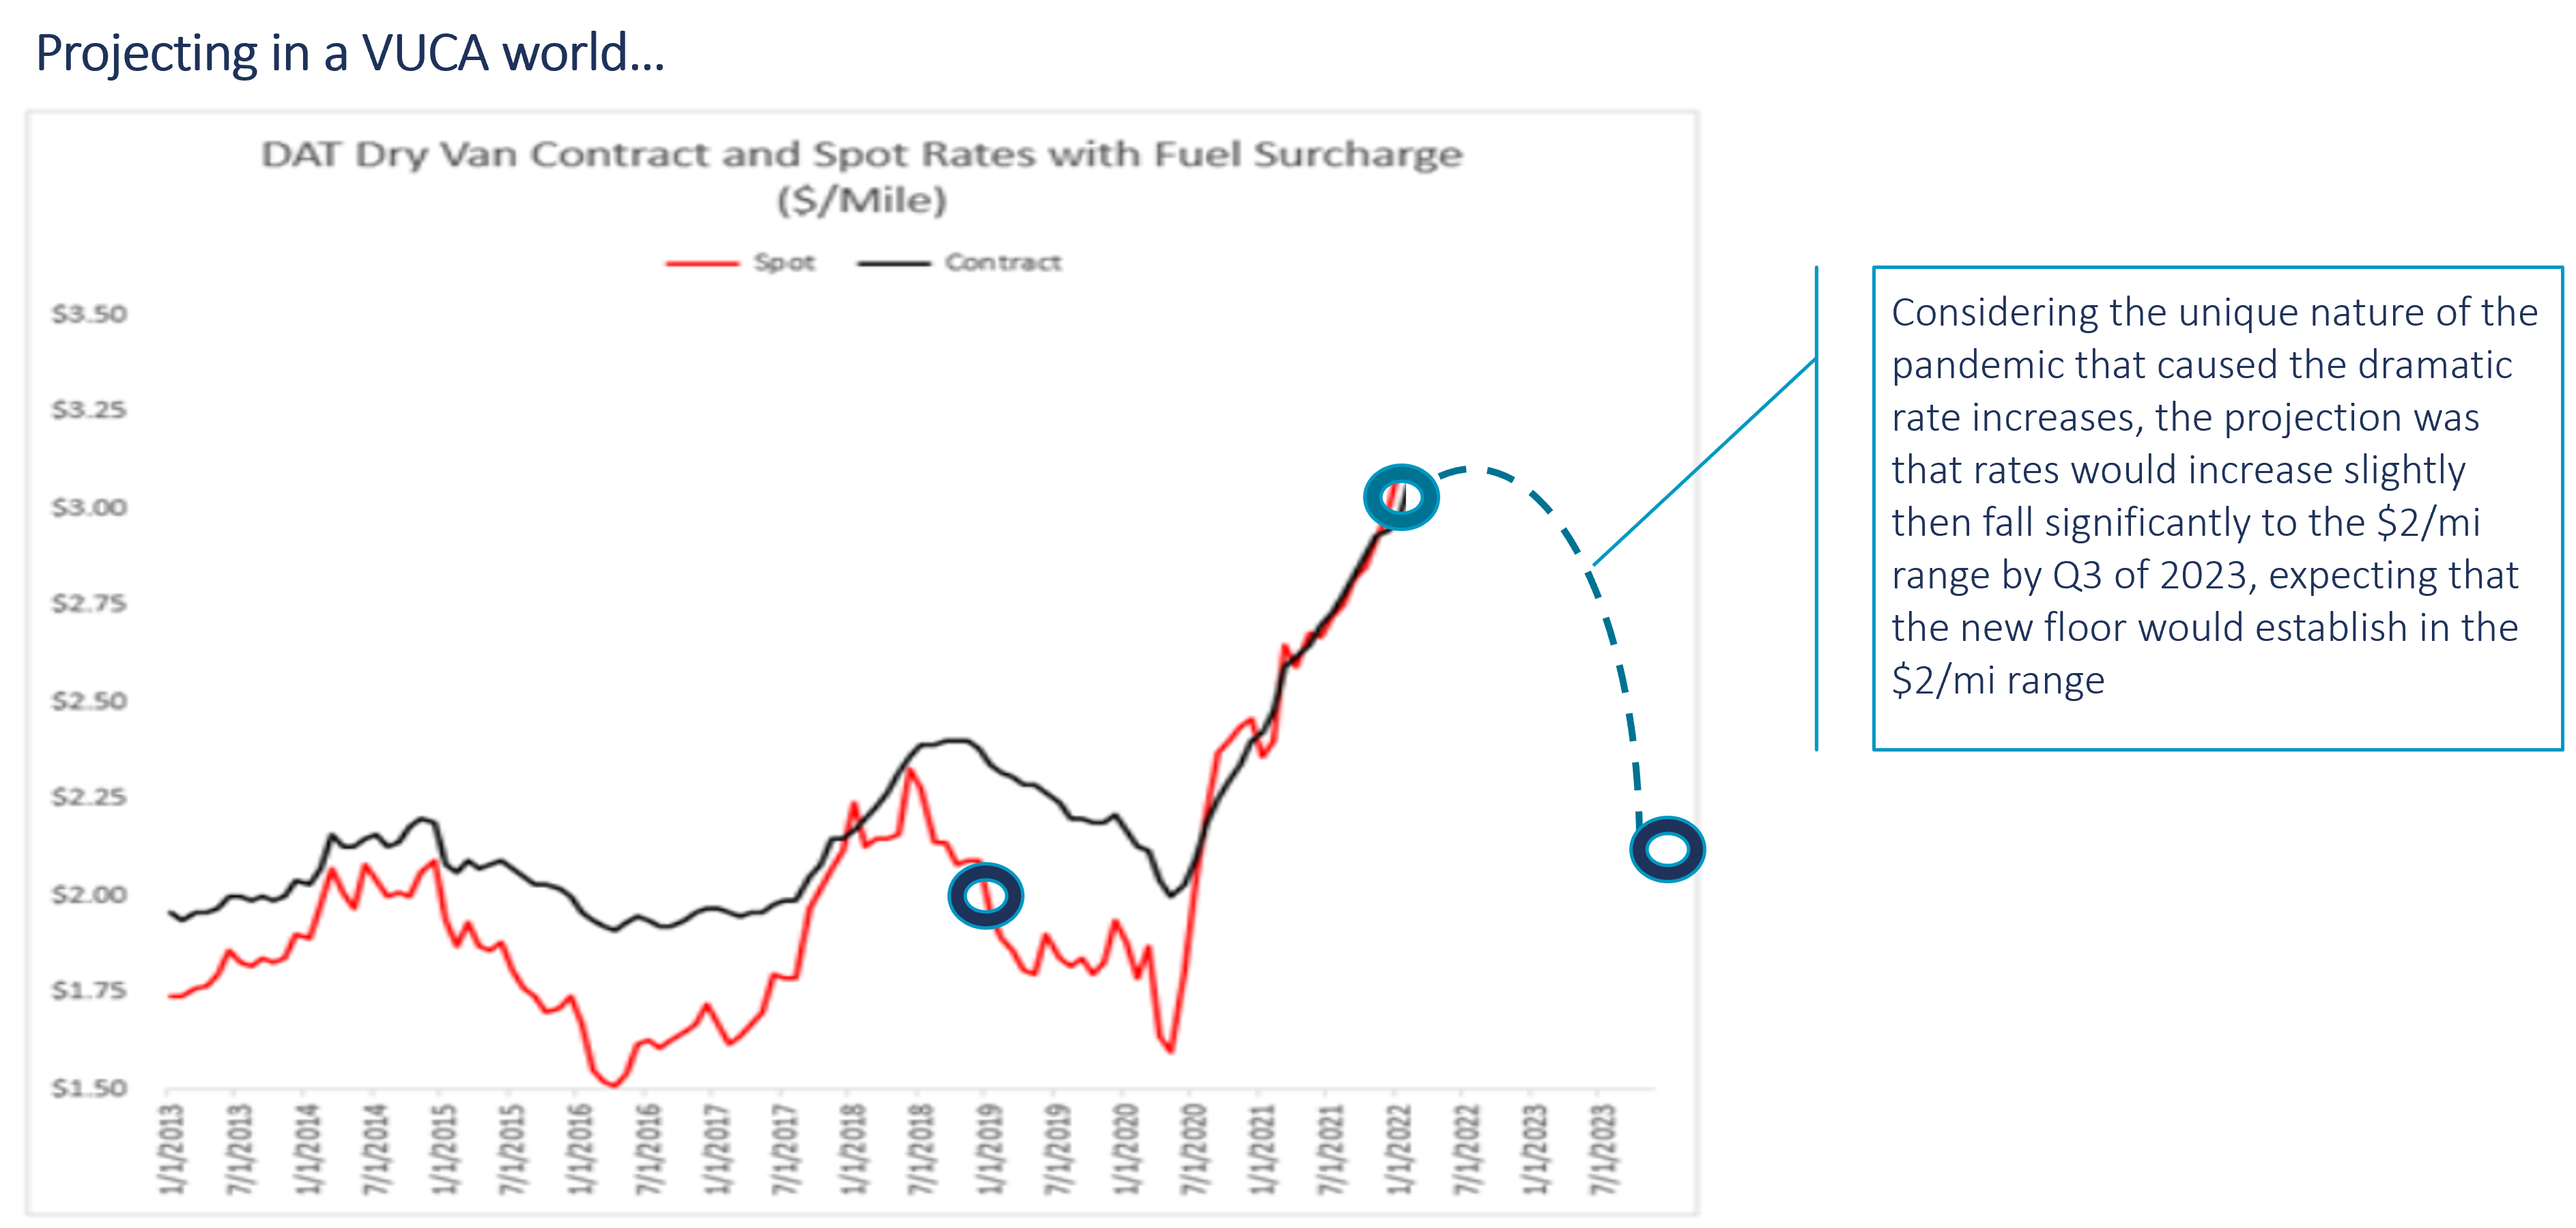
With freight rates, what goes up generally comes down. Dry van freight rates are historically cyclical. An ever-changing set of factors influence dry van spot market rates, but the cycles definitely exist. It is generally just a matter of what the peaks and valleys are and how much time is between them. But none of the project team, nor the client, had ever experienced a pandemic. Because the last one of this magnitude was in 1918. The volatility, uncertainty, complexity, and ambiguity (VUCA) of the situation was unprecedented. CAMELOT’s charge was to predict freight rates over the next two to three years in this VUCA environment.
The first challenge was to guess whether rates were going to continue to increase or if they had topped out. There was a lot of knowledge from experts we could collect regarding the next three to four months. We all aligned that the rates would continue to increase for a few months and then peak.
However, beyond those next few months, the confidence from the experts waned quickly. We therefore had to make our own assumptions. Would rates then drop and, if so, how quickly? While it is simple to put into words now, the mental gymnastics for the project team to conclude that rates would drop again nearly as quickly as they escalated caused more than a little consternation.
Predictions Turned into Reality
Consternation aside, we presented to the executive team that, even though the pandemic presented unprecedented circumstances, dry van truckload rates would follow a similar cyclical pattern and drop to about $2/mile by the end of quarter 3 in 2023 – about 20 months later.
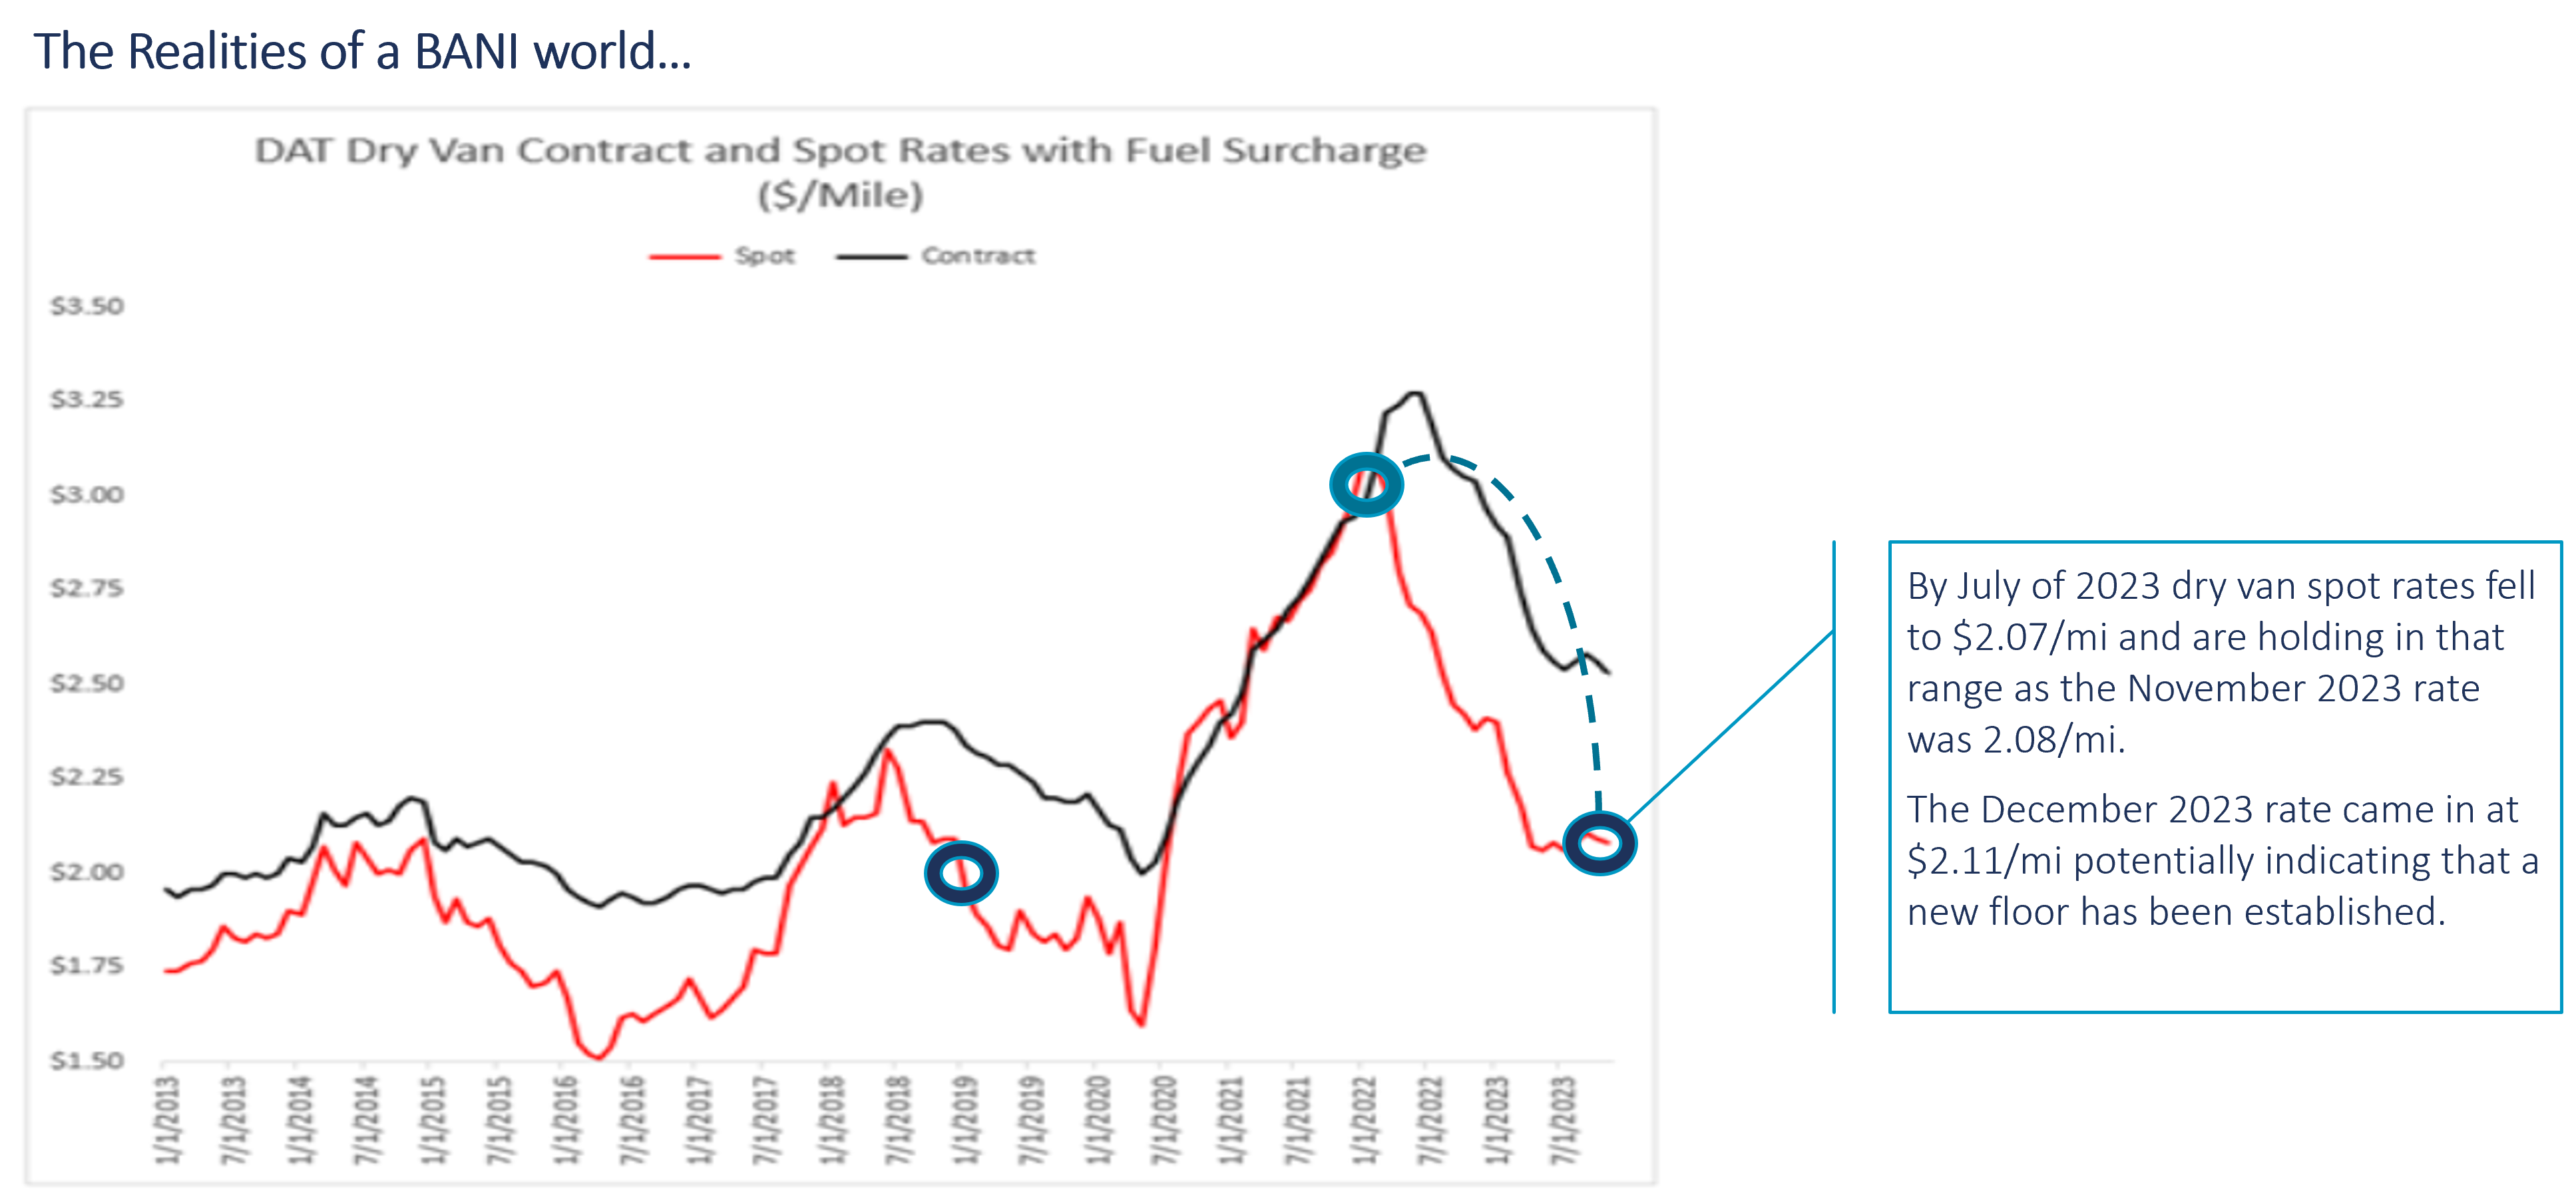
It would be inaccurate to say that the entire executive team was aligned. Understandably, several executives thought the world had changed for good. The new acronym BANI (Brittle, Anxious, Non-linear, Incomprehensible) came to mind. That said, decisions can only be made with the best available information.
Now that time has passed, it is uncanny to see just how close our projections came to reality. The dry van truckload spot rates did continue to increase, by even more than we projected. Shortly thereafter, the decline ensued, and at an even faster pace than our guess. Time will tell if the rates have bottomed out. Some recent projections indicate that they might have.
Reinforcing the Need for Network Sensitivity Analysis
If the world is transitioning from VUCA to BANI, a sensitivity analysis in supply chain network design projects becomes more valuable. Most of the time, a sensitivity analysis includes escalations or reductions in important assumptions of 10% to 20% and a few iterations as different variables are analyzed in conjunction with one another. For example, what if assumption A increases by 20% while assumption B decreases by 10%. The iterations of sensitivity analysis are usually time-boxed and occur towards the very end of the analysis. As a result, sensitivity probably does not get the attention it deserves as most involved with the project are celebrating the result. They are not so energized to continue to challenge it.
That said, how often will events of pandemic proportions really occur? Maybe more often than we would expect in a BANI reality. Perhaps a sensitivity scenario should include fluctuations of important variables of 50% or more. Pragmatically, the balance between “aligned” results and potential “analysis paralysis” comes into play. Luckily, the data and analytical tools are more readily available today and can support whatever depth of sensitivity analysis is desired.
This example certainly represents a unique instance of sensitivity analysis. Usually, an uncertain future is being analyzed based on variations in assumptions. Here, the delays caused by the pandemic put us in a “future” that was not considered by any previous sensitivity. While it was not ever considered to “escalate” dry van TL rates by over 50% in the initial analysis, in the re-analysis we were projecting that rates would fall nearly as much within two years. And, lo and behold, they did. The project demonstrated that it is sensible to expand approaches to sensitivity analysis.