
Since the launch of Integrated Business Planning (IBP), SAP has always proposed pre-configured setups to help customers along their IBP journey, from the awareness to the implementation phase. There are numerous pre-configured envelopes, so called ‘SAP Samples’. It started with SAP2 and SAP4 for what was known in 2015 as S&OP for HANA. Fortunately, SAP is moving away from a too technical naming (HANA, I like performance but not in the name) to a more process-oriented wording and has renamed its solution to SAP IBP.
From July 2016, IBP has evolved from the S&OP module to Demand, Supply, then Supply & Response, then Inventory, then DDMRP, Foundations, Supply Chain Control Tower (SCCT). With each new incoming module, a new SAP sample was introduced. SAP3 for Inventory, SAP6 for Demand, SAP5 for SCCT, SAP7 for OBP (Order-Based Planning), SAP8 for DDMRP, SAP7F for OBP again with flexible master data.
With the introduction of IBP as a clear product line, SAP also introduced the SAPIBP1 Sample, which did not aim at representing a single IBP module, but several, combined in the same envelope. The introduction of SAPIBP1 was obviously aligned with the experience of customers, who used several modules. This made absolute sense, as before SAPIBP1, you had to cherry pick elements from several samples to build the customer target configuration.
Samples are important to enable customers and consultants to get into the IBP story quickly and safely. Creating an IBP setup from scratch is not an option, never! Neither creating a simple copy of a sample to become a customer solution delivery, never ever!
Creating an IBP setup from scratch is never an option, because the IBP engine is a powerful but tricky thing where attributes and key figures must have the proper technical name to enable the good IBP operators to run. Should you name the product attribute anything different from PRDID, IBP will not work. Should you call your projected stock inventory any different from PROJECTEDINVENTORY you will never see that stock in your key figures. This is better in the Demand domain with its semantics, but still techy.
So, using samples as a starting point saves a lot of time and helps you avoid many errors. It also provides an initial setup of formulas that establish the relations between key figures, which would take ages to do manually.
In addition, it provides the relevant associations of attributes, so-called planning levels, that structure the targeted solution to manage the many supply chain dimensions like customers, locations, products, resources, months, weeks etc. In contrast to APO, in IBP you can include all necessary dimensions in the same planning area and establish relationships like Week-Product-Location, Month-Product-Customer, Day-Product-Location-Resource, etc.
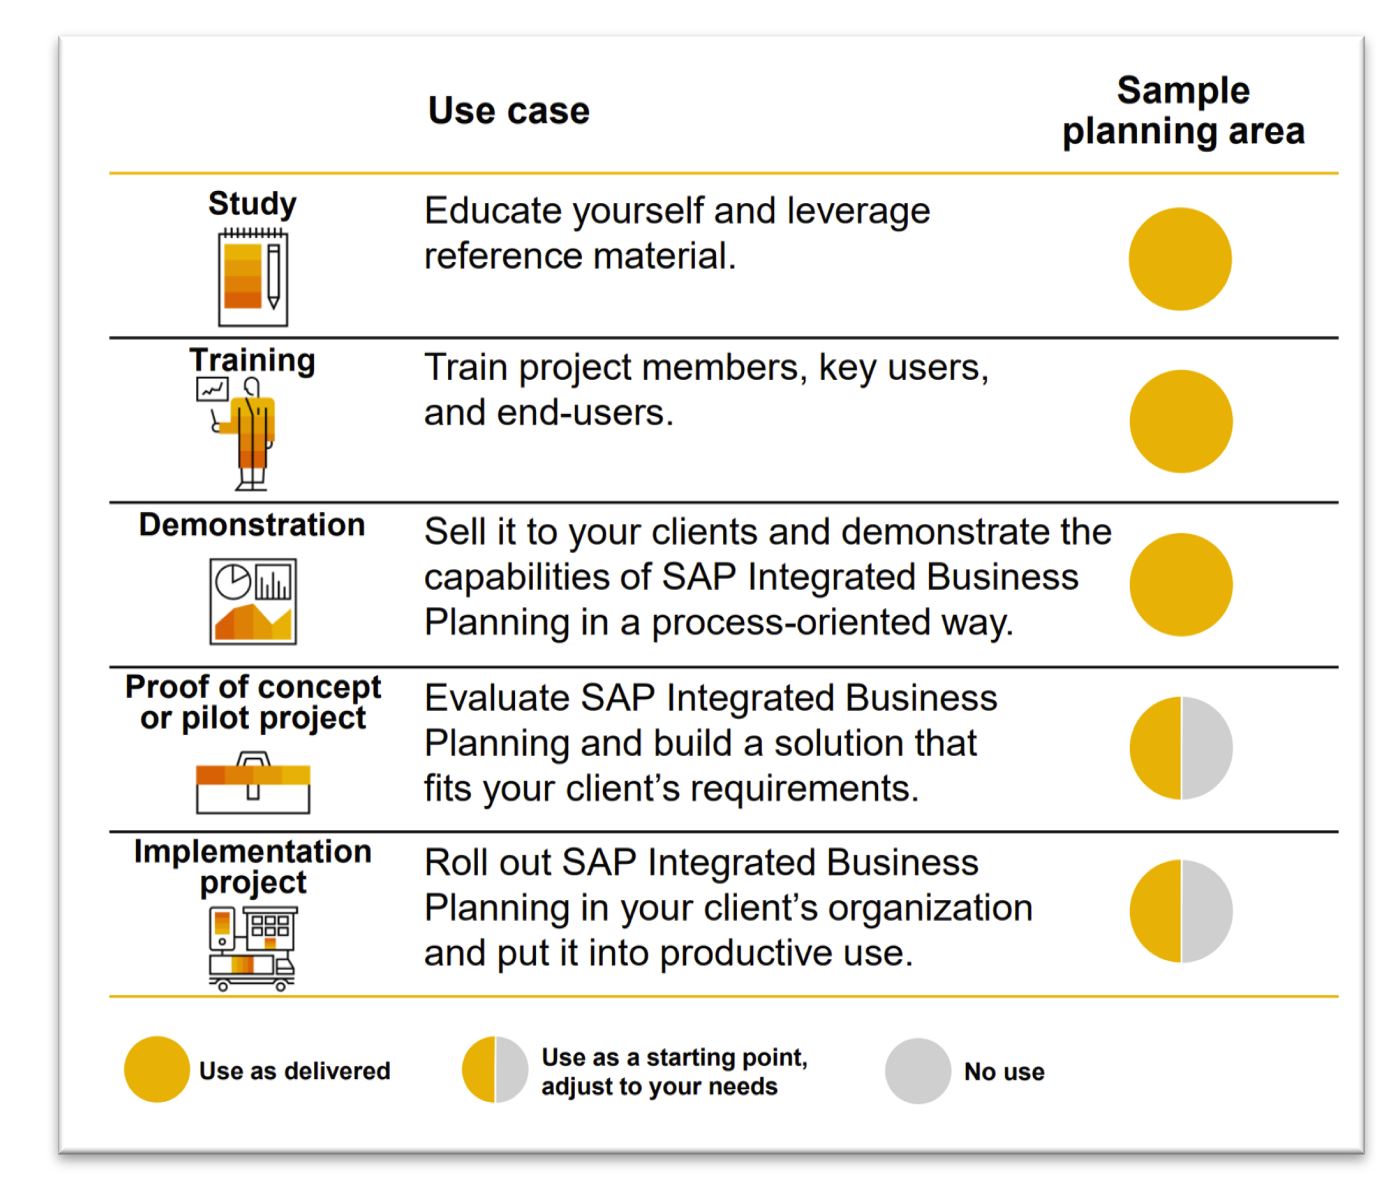
Never use a sample as such for a go-live target, because these are designed with a too simplistic scenario that illustrates IBP features only. SAP states this clearly on the IBP main help page (see figure). Samples are good for learning, initial training, however not for go-live as such.
So, What Is in SAPIBP1?
The answer is: a lot, too much, and not enough!
A LOT, as it covers S&OP, Supply (time series only), Demand, Demand Sensing, and Inventory, with a few KPIs cherry picked from SCCT SAP5. In total, as of IBP release 2211, 100 planning levels, 50 attributes (dimensions), 485 key figures.
TOO MUCH, for an easy implementation and smooth maintenance later. For an IT member that means you understand and master each of the 485 key figures’ roles, formulas, and how they are involved in the many planning levels. Not easy indeed. It takes time to understand this. That said, I know some productive customers’ settings (not mine) with 1,200 key figures, even 2,000!! I heard from them that maintenance was not an easy task. Indeed!
NOT ENOUGH, because the content of each proposed domain is too simple. Like in S&OP where I would expect a little more about demand review, supply review, NPI reviews, financial breakdown review, or management business review meeting. Or like in Demand with statistical, local, and global demand only, but without any sales forecast, customer forecast, marketing forecast, or achieved consensus.
NOT ENOUGH, as not all key figures are convertible into any unit of measure or currencies. NOT ENOUGH, as integration into S4/HANA is still a big customizing effort, although the IBP add-on is progressing. NOT ENOUGH, as the IBP Excel add-in is basic from the UI and UX perspective.
Is that an issue? Obviously not! Implementation consultants play an important role in collecting customer requirements and in challenging organization and project structures to come up with a refined setup that covers the expectations. An interesting journey, which takes at least six months per module, not only 90 days like we can read sometimes. I will talk more about this in one of my next articles.
IBP Implementation Cookbook
To come to the end of this post, the cookbook I adhere to during an IBP implementation is as follows, with change management being deeply recommended.
- First ‘As-Is’ review interviews (no system) to get the customer’s current business paradigm and IT landscape, possibly collect user stories
- Second, train the project team with SAP standard training, sometimes using SAPIBP1.
- Third, design process and solution requirement (still no system, only demo with SAPIBP1).
- Fourth, write business blueprint and define phased implementation plan.
- Fifth, possibly create a POC, starting with SAPIBP1, cleaned from unnecessary features.
- Sixth, start building the solution, sliced in Scrum phases (sprints), including TUT (Technical Unit Testing), FUT (Functional Unit Testing) and IUT (Integration Unit Testing).
- Seventh, train key users with dedicated project material.
- Eighth, go-live and post-go-live support
- Go to next phase.
Specifically related to this post, the 6th step, like the 5th, starts with a simple copy of SAPIBP1 into the targeted customer planning area(s), according to the retained split architecture. Either you decide for a unified target, with all domains in the same planning area, or for a split one per domain, per business unit, per region, etc. I am more inclined towards a split one, as unified generates a lot of UI and UX difficulties, a tremendous maintenance effort, and often customer misunderstanding. The matter is not that consultants understand what they do during design, but that customers get their delivery and can operate it!
After copying the sample into the target planning area, I recommend deleting the unnecessary attributes, planning levels and key figures as they will jam the end-user screen and generate useless questioning. Should you need to later come back to these deletions, nothing easier than to copy from any sample into your target again. I have seen so many examples with 600 customer-facing key figures and only 20-30 of them being used, just because these 580 looked so SAP standard that we better kept them. Just in case. Likely also because we don’t have time and budget to delete the unnecessary ones. A typical result per domain should be around 50-100 key figures in Demand Planning, 120-150 key figures in Supply Planning, and 50-100 key figures in S&OP. From attribute perspective (product, customer, locations…), unified or split does not matter, they can be shared, and be around 80-100.
Fact is, considering the IBP-internal design with formulas, the number of key figures has dramatically increased compared to APO, that was using a macro-builder.
Before we quit, think about visiting the IBP influence platform to leverage SAP design to allow a clear decoupling between design and users. I would love having many key figures and attributes while being able to easily decide, by design, not by authorization, to present only the relevant 50 key figures and 20 attributes to demand planners, or 80 key figures to supply planners, etc.
Enjoy IBP!