
Public holidays, often seen as a time for relaxation and celebration, play a significant role in the business world, particularly in the realm of sales. These special days can significantly impact consumer behavior, leading to noticeable shifts in sales patterns. For instance, grocery stores often witness a surge in sales the day before a public holiday, while restaurants and beer gardens may experience increased demand on the holiday itself. Understanding these patterns and effectively leveraging them can provide businesses with a competitive edge.
For Camelot’s Public Holidays Data Product, we developed a use case that demonstrates the practical benefits of incorporating public holidays data into sales forecasting. We will share our journey of generating the necessary data for sales prediction, the steps involved in the prediction process, and how we visualized the results to gain meaningful insights.
Sales forecasting is a critical aspect of business planning. Accurate forecasts enable businesses to manage their resources efficiently, anticipate demand, and optimize their strategies. By incorporating public holidays data into sales forecasting, businesses can gain a more nuanced understanding of their sales patterns. This can help them better anticipate periods of increased demand, allowing them to prepare adequately and maximize their sales potential.
Let’s dive into the steps of our process one-by-one:
- Data generation
- Sales forecasting
- Merging the data into SAP Datasphere
Data Generation
In this phase, we generated sales data using Python, running our scripts on Google Colab. The data spans from 2018 to 2022, providing us with ample historical data to ensure the accuracy of our sales forecast. For this use case, we focused on four stores located in different states and municipalities in Germany: Munich, Augsburg, Berlin, and Dresden. This selection was intentional, as public holidays vary across different regions in Germany, and our public holidays dataset provides data at the granular level of postcodes and municipalities.
The data generation process involved creating several key figures. We assigned random numbers within a specific range for variables such as the number of visitors (between 600 and 800) and the average payment (between 15 Euros and 25 Euros). The revenue column is a multiplication of the number of visitors and the average payment.
To account for the impact of public holidays and Sundays, when the stores are closed, we set these days’ sales to zero. On the other hand, we increased sales by 50% for the day before a public holiday or a Saturday, reflecting the surge in shopping activity typically observed on these days. This adjustment was made possible by reading the public holidays from a separate CSV file, which is an extraction from our public holidays data product, and checking whether each date was a public holiday based on the postcode.
Sales Forecasting
After generating our data, we moved on to the next phase: sales forecasting. For this step, we turned to Python and the Facebook Prophet library, a powerful tool for forecasting time series data. Prophet is particularly effective with time series that have strong seasonal effects and several seasons of historical data, making it an ideal choice for our use case.
Prophet is a library developed for predicting time series data. It uses an additive approach that accounts for non-linear patterns, taking into consideration daily, weekly, and yearly seasonality, as well as the impact of holidays. It is most effective for datasets with pronounced seasonal variations and multiple seasons of historical information. One of Prophet’s strengths is its ability to deal with data gaps, trend changes, and generally manage anomalies effectively. This open-source tool was introduced by Facebook’s Core Data Science division.
Prophet operates based on an additive model, fitting non-linear trends with yearly, weekly, and daily seasonality, plus holiday effects. This feature is crucial for our use case, as it allows the model to consider the impact of public holidays and seasonal effects on sales.
The Prophet library requires two fields: ‘ds’, which refers to the date, and ‘y’, which refers to the key figure to be forecasted. Our code loaded the public holidays data, which was then factored into the ‘holidays’ parameter during the model training process.
After creating and training the model, we exported the data to a CSV file. This forecasted data was then combined with the actual data.
Merging the Data into SAP Datasphere
Once we had our forecasted and actual sales data ready, the next step was to load this data into SAP Datasphere.
In the space dedicated to our use case within SAP Datasphere, we started by creating a table and loading the CSV file extracted from the sales forecasting step. This table contained both our historical sales data and the forecasted sales data.
To enrich our data further and provide more context, we created a graphical view where we joined this table with the daily view. This allowed us to incorporate public holidays information, as well as additional state and town information into our dataset such as Baden -Württemberg state has a town Mannheim. The join was performed on the date and postcode fields, ensuring a precise match between the sales data and the public holidays data.
Unveiling the Results
After merging and loading our data into SAP Datasphere, we turned to SAP Analytics Designer to visualize the results. Using a combination of time series charts and bar charts, we were able to bring our data to life and uncover some fascinating insights.
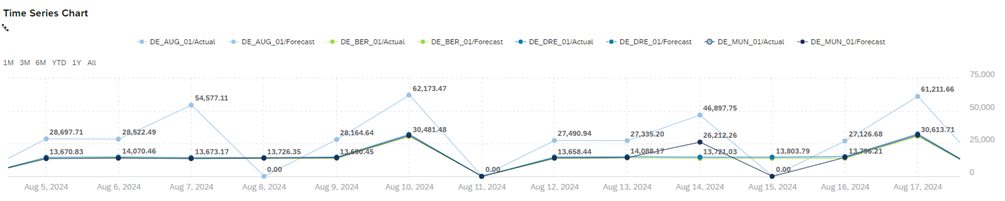
One of the key highlights from our results was the clear difference in public holidays between different locations. This was particularly evident when we looked at the sales forecast for August 8th. For the store in Augsburg (DE_AUG_01), the sales forecast for this day was zero, indicating a public holiday (Augsburger Friedensfest) as shown in Figure 1. However, for the store in Munich, it was a normal working day. This discrepancy occurred because the public holiday on August 8th is observed only in Augsburg, not in the entire state of Bavaria. Consequently, we see a forecasted spike in sales for the Augsburg store on August 7th, the day before the public holiday.
This pattern was also observed on August 15th (Maria Himmelfahrt), a public holiday in Bavaria. On this day, the forecasted sales for both the Munich and Augsburg stores dropped to zero, with a forecasted spike in sales on August 14th, the day before the public holiday.
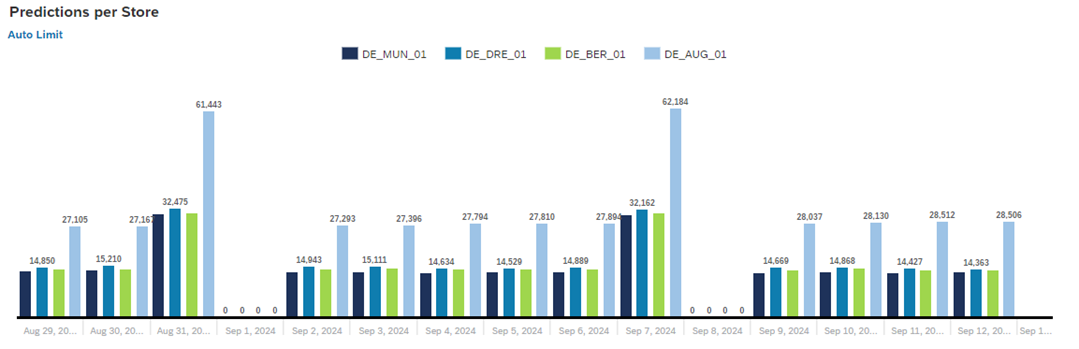
Our bar chart further illustrated the impact of weekends on sales. As shown in Figure 2, the model forecasted zero sales on Sundays (September 1st and 8th) for all stores, reflecting the fact that the stores are closed on this day. Correspondingly, there was a forecasted spike in sales on the preceding Saturdays (August 31st and September 7th), indicating increased shopping activity before the stores’ closure.
Conclusion
In conclusion, the insights derived from our sales forecasting model, particularly the significant impact of public holidays and weekends on sales, offer businesses a more nuanced understanding of their sales trends. By incorporating these factors into their strategic planning, businesses can anticipate sales fluctuations more accurately and make informed decisions that drive growth and success.
To find out more about a Public Holidays Data Product use case, watch this video!
The Public Holidays Data Product is available on the SAP Data Marketplace: