As part of global digital transformation and acceleration of value chain processes within its own SAP S/4 HANA Cloud implementations, Camelot focuses its strength on analytics for procurement as well. This article shows the capabilities that the company chose to implement, the benefits of this transformation journey for the company and our clients.

Camelot constantly works on the transforming the procurement analytics in the internal and customer projects with SAP S/4 HANA Cloud. Before, the project managers struggled with providing relevant insights into the data related to the procurement process. They had to spend much time to create necessary reports and have better visualization necessary for the reduced costs and decision making related to the ordered goods and services, goods receipt etc. Now it is possible to use the spend visibility as well as real-time reporting and monitoring. The project managers can for example make instant decisions about which suppliers to choose based on up-to-the-minute information. They can instantly resolve business issues by quickly navigating from analytical application to the transactional applications and back.

How do we use S/4HANA Cloud-based procurement analytics?

In this article you will be introduced with the most important analytics apps related to the procurement process in the SAP S/4 HANA Cloud. You will see which benefits they provide, which options you have from the functional point of view, and how they look like in the system.

The apps we will show in this article are just some of the many analytics capabilities which the SAP S/4 HANA Cloud system provided. The right choice of apps and their implementation always depend on the individual business requirements of a company.

Procurement Overview Page

At which point of time in your daily business do you want to be up to date at one glance? And why?

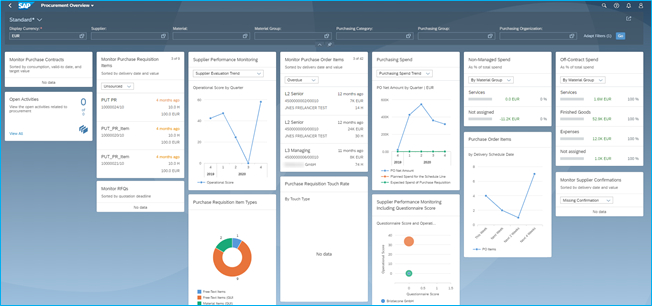
The procurement overview page displays the most important information and tasks relevant to a purchasing department in a dashboard view. When you first open the Procurement overview app, by setting the filtering options by different business attributes like supplier, material group, etc., the dashboard opens with the actionable cards. (Figure 1) The actionable cards are created based on previously setup criteria and ranked according to relevance. They allow our purchasers to get a high-level overview, for instance of overdue purchase order items, expiring ones, or an overview of different procurement key performance indicators (KPIs). These KPIs help monitor non-managed spend or purchasing spend and quickly discover trends and potential areas of improvement.

Each of these cards represents an app that will open, when you click on it, allowing to navigate quickly to an object page to see all details of the purchase order, or the specific supplier. In the object page of the purchase order, you can see all related details, like for example goods receipts or invoices which are created based on that purchase order.

Your Dashboard might look like the example in figure 1:

Figure 1: Procurement Overview Page

Monitor Purchase Order Items

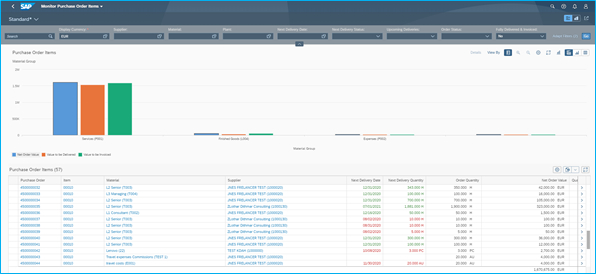
Using this app, you can have better transparency of the most important information related to the purchase order items, from the point of the spent quantity and items which are overdue, using graphic view or monitoring these items in the table. It saves a lot of time where we have on one place the information which we would collect manually using the data combined from many other different apps.

Our purchasing department can search for a list of purchase order items based on different filter criteria, for instance, suppliers or materials. As you can see in figure 2, they check for overdue orders in various statuses, e.g., approved or received orders, or the value to be invoiced or delivered. By providing an analytical list page for purchase order items using chart elements and visual filters, the app enables the purchaser to analyze specific business situations. There is also the possibility for navigation from a table to object pages or to download the results to Excel.

Please find further information here: Link.

Figure 2: Monitor Purchase Order Items Analytics List Page

Purchasing Spend Dashboard

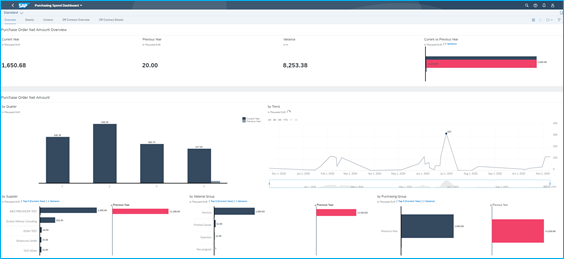
The Purchasing Spend Dashboard app as seen in figure 3 provides our responsible purchaser with real-time insights into purchase order net amount across different dimensions, such as spend by quarter, supplier, purchasing organization, etc. The purchasers manipulate and query data across any dimensions they need in the easy-to-use SAP Analytics cloud design. The analyzed data is presented in a variety of graphs, such as bar charts, column charts and tables on tabs (here are only the tabs Camelot uses):

  • Overview – overview of the purchase order net amount
  • Details – insights for the purchasing spend information in a more detailed manner
  • Context – analysis of the pricing details

Please find further information here: Link.

Figure 3: Purchasing Spend Dashboard

Purchase Order Visibility and Procurement Spend

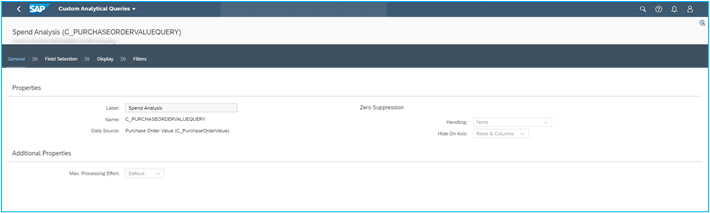
For purchase order visibility, we use a prebuilt set of Key Performance Indicators (KPIs), which can be used in different scenarios, such as SAP Analytics Cloud (SAC) Stories. Stories are where you explore and visualize data for reporting, planning, and analysis. Camelot’s decision-makers monitor simulated changes that show an overview and line-item details. We use procurement related Core Data Services (CDS) views to leverage extensibility and reporting functionality.

Figure 4 shows one of the prebuilt CDS queries for evaluating/analyzing the spend incurred for purchase orders for the purpose of reducing the overall procurement cost. More information about CDS views: Link.

Figure 4: Custom Analytical Queries

View Browser

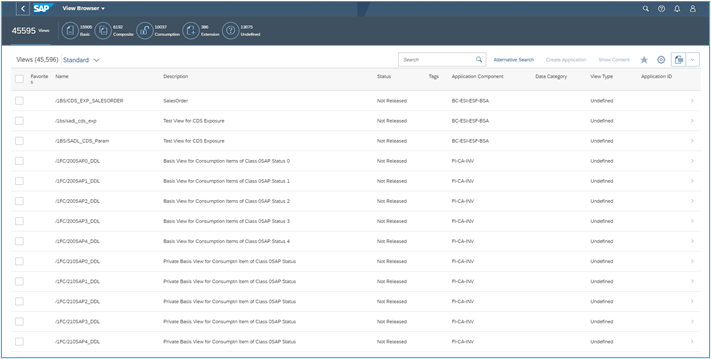
We use the app “View Browser” as shown in figure 5 to search, browse, and tag analytical and non-analytical queries, and analyze, among others, procurement data fields of the CDS views. Camelot uses various search options, such as description, application components and tables used in building the CDS views to search for CDS views. Some of the app’s key functions we leverage are:

  • Views – displays the number of all CDS views that are available in the system
  • CDS View Status – create, save, modify, and publish CDS views to catalogs using the Custom Analytical Queries app (a tool used for reporting and analysis)
  • Search: search for views, view types, view categories, tables, view descriptions, view column names, annotations, or user-added tags

Please find further information on this app here: Link.

Figure 5: View Browser – Browse Views

How this helps our clients

Our customers from multiple industries such as chemicals or consumer goods have different needs based on the complexity of the organization and the supplier landscape.

Combining best-in-class technology and AI-based analytics with deep supply market and category sourcing expertise, we enable our clients to unlock value in their procurement data. We help them track their procurement performance on different levels, in different dimensions, and in real-time. They achieve full spend transparency and can identify short-term savings opportunities with immediate ROI.

Conclusion

The S/4HANA Cloud capabilities we described help our internal procurement key users and clients to better perform in their daily tasks. They can view the required information in a single place, without having to open multiple reports and transactions. They have extensive, real-time transparency on purchasing spend. Instant insight-to-action capabilities provide them with navigation to the relevant business processes and objects. By directly accessing purchasing analysis in real-time, they can accelerate reporting cycles. As one of the key features of SAP S/4 HANA Cloud, they can quickly configure different KPIs and cards and adapt them to their needs. Data can also be visualized in various chart types and by specific criteria based on business needs. With spend visibility in the cloud, purchasers gain a holistic view of corporate spending in real time and can identify and act on cost saving opportunities for cost savings.

If you are interested to learn more about procurement analytics with S/4HANA Cloud, feel free to contact our team at the following email address: s4cloud@camelot-group.com

Sources:

SAP Best Practices Explorer (only with authorization)

SAP Learning Hub (only with authorization)

SAP Help Portal

In this lose series, we give insights how we use SAP Features ourselves. Our hope is to give you detailed insights in what you can achieve with a specific feature and see for yourself,

Our first article describes the test automation in SAP S/4HANA Cloud Implementations here.

We would like to thank Jasmina Nesovic for her valueable contribution to this article.

SAP S/4 Transformation: Survey on Expectations

The study "Expectations on S/4HANA in 2022" by techconsult and CamelotITLab shows possible painpoints in any migration and how they can be avoided. With data from 200 companies in Germany.

Download the complete study

Recommended articles

Data & Analytics

Introducing CIDS – First Services Available

In our PREVIOUS ARTICLE, we introduced CAMELOT Intelligent Data Services (CIDS) – a combination of tools that improve data quality, save time …

read more
Future Value Chain

Integrated Business Planning – Enterprise Planning for a Volatile & Complex World II

In the first part of this blog post series I explained why IBP is used at leading organisations to create robust …

read more
Innovation

Extreme Data Maintenance Automation Powered by SAP Data Intelligence

Manual system maintenance of information based on paper forms is an activity that is part of everyday corporate life in many …

read more

Reimagine your Value Chain with us

Contact us