
In response to the uncertainty that COVID-19 has introduced in the last year, CAMELOT, a supply chain expert, has been discussing many new angles with our customers in the past months.
Where previously costs were considered to be the driving factor, many businesses have been primarily concerned with finding quick opportunities to free up liquidity. Based on this experience, we’ve added two new tools to our supply chain design toolkit.
NWC Calculator
More than 50% of our customers still work with target stocks that are determined on the basis of rules of thumb, such as ranges of coverage. In most cases, these rules apply to entire product clusters and/or markets, and they are applied independently of the individual qualities of the respective supply chain, such as the production, distribution center and demand patterns. In most supply chain design projects, we try to sensitize our customers to a new standard for calculating target stocks:
Volatility-driven safety stock calculation
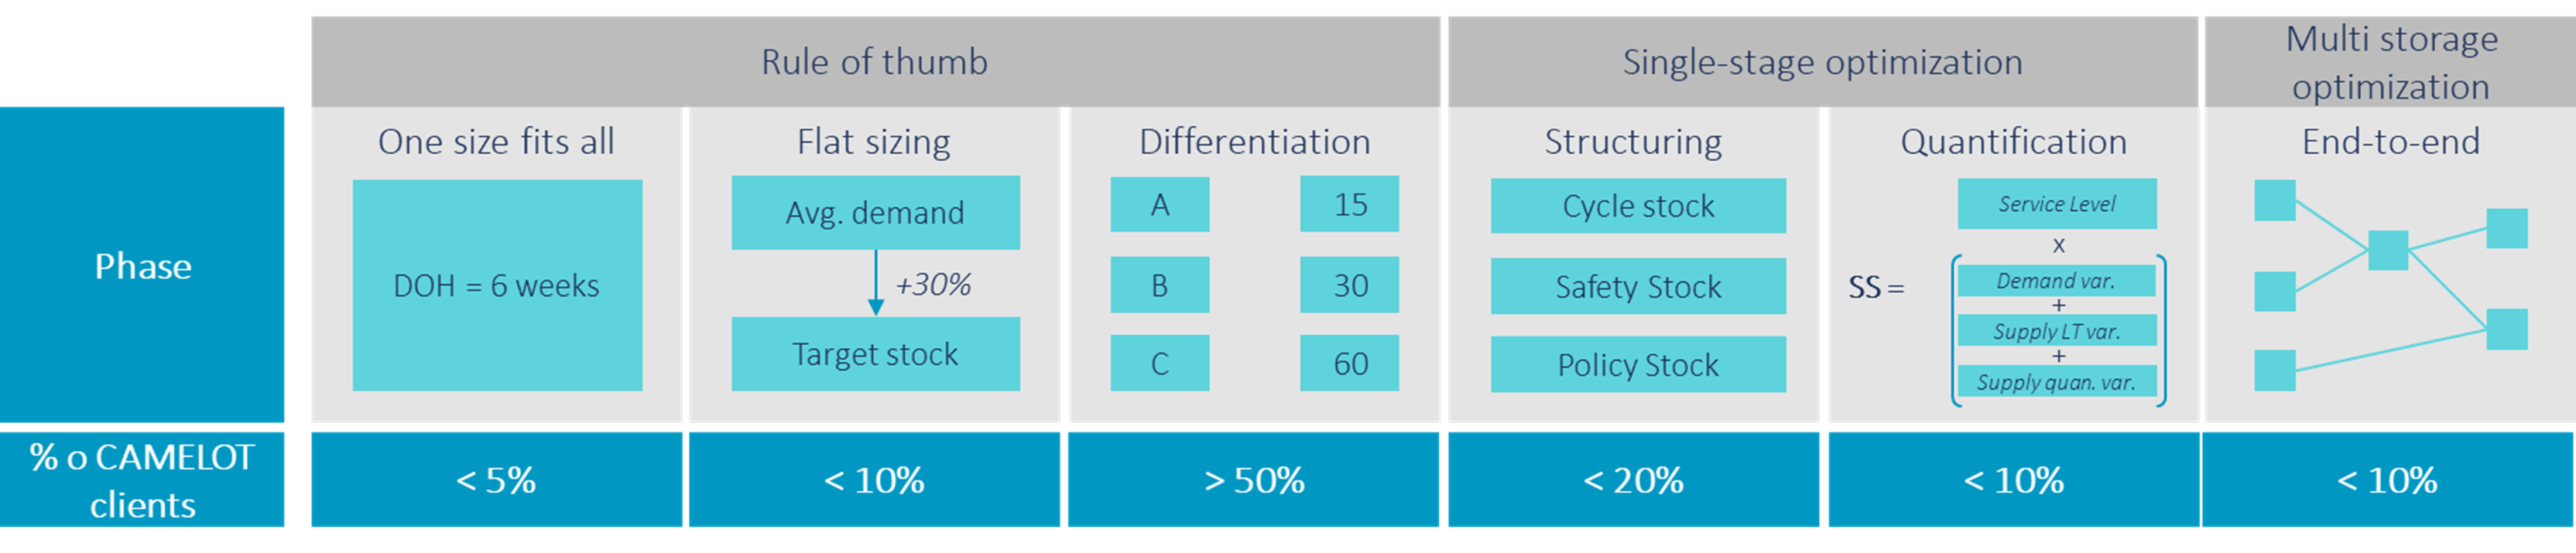
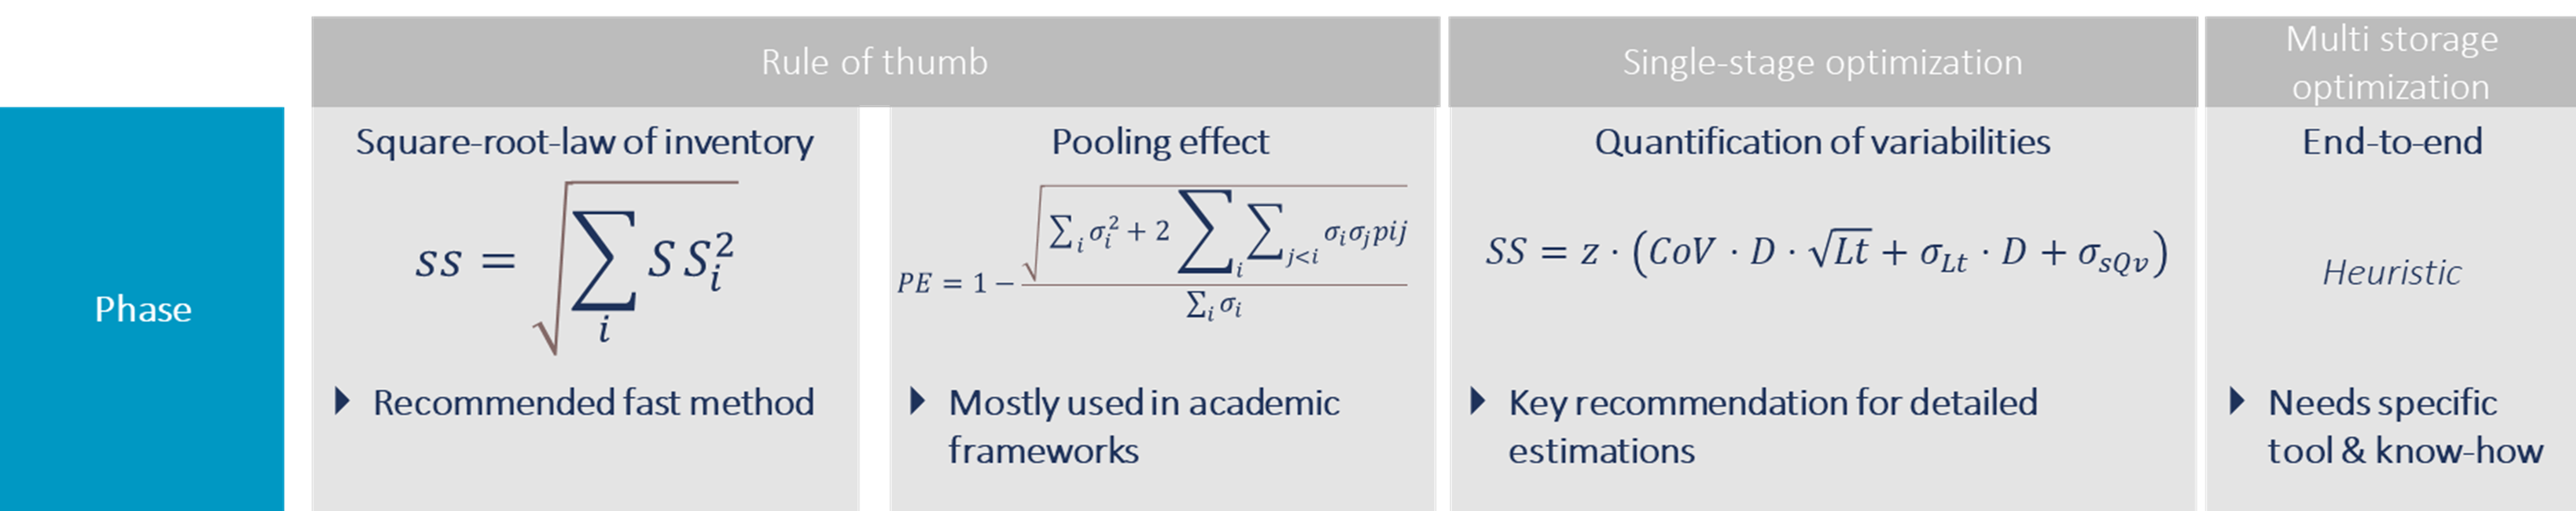
Using this method, an individual safety stock is calculated for each material number. This safety stock already includes demand patterns, delivery times along the supply chain and typical risks. This is not only a more precise way of calculating the target stock level – it also proves to be a great help in times like these, when we are exposed to unprecedented and extreme supply chain fluctuations.
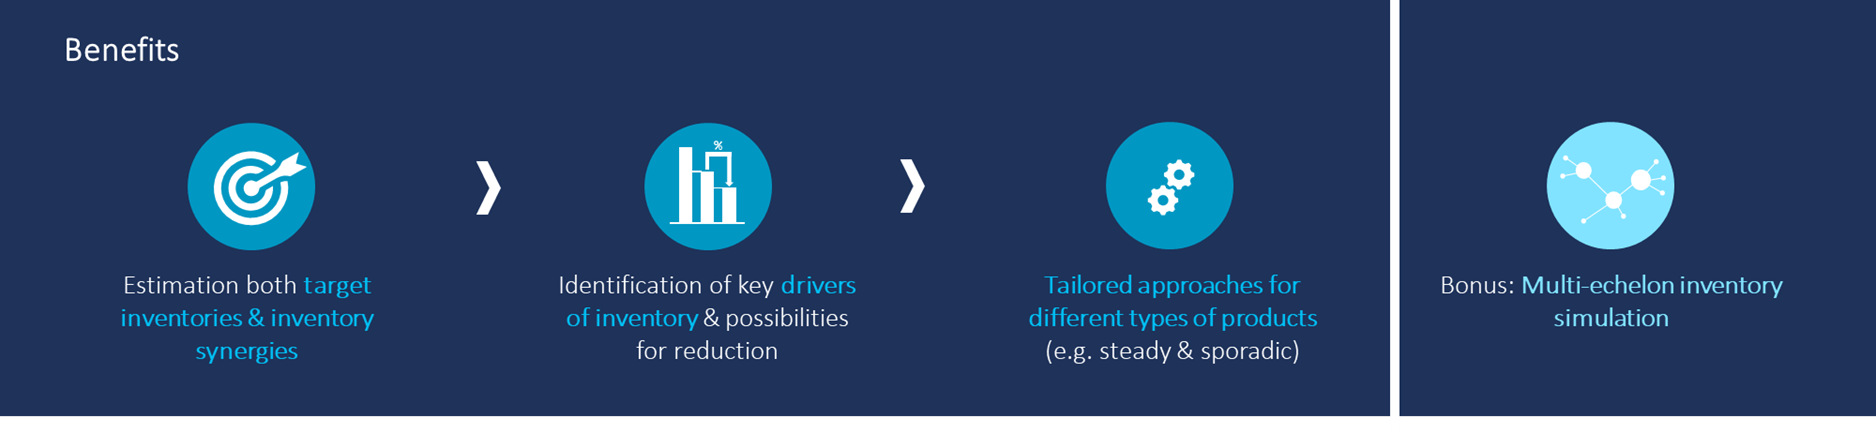
In addition to the integrated solutions included in supply chain planning, for instance SAP IBP, we like to use the NWC (net working capital) Calculator in the supply chain design environment due to the fact that stocks are an important improvement lever, both for increasing delivery capabilities and for reducing stock sizes. Using a range-based stock calculation, one would have to work from the perspective that, for example, centralizing the stocks has no influence on the overall stock level. The target stock level would be the range * total demand instead of the individual demand levels in the individual warehouses. With the volatility-driven approach, the new parameters can be calculated quickly and easily – and in most cases the fluctuations across different markets or sales channels balance each other out. This way, a lower fluctuation margin results in lower safety stocks.
In our new tool, the NWC Calculator, we provide a pragmatic way to implement this. The tool allows a supply chain to be configured per material from production up until it reaches the customer, and it includes the definition of demand as well as demand fluctuations. All of the logic, from target stock calculation to the simulation of stock (de-)consolidation is already included. The technical basis (MS Excel) ensures that our customers can easily make individual adjustments and that the logic is fully transparent.
Obsolescence Simulator
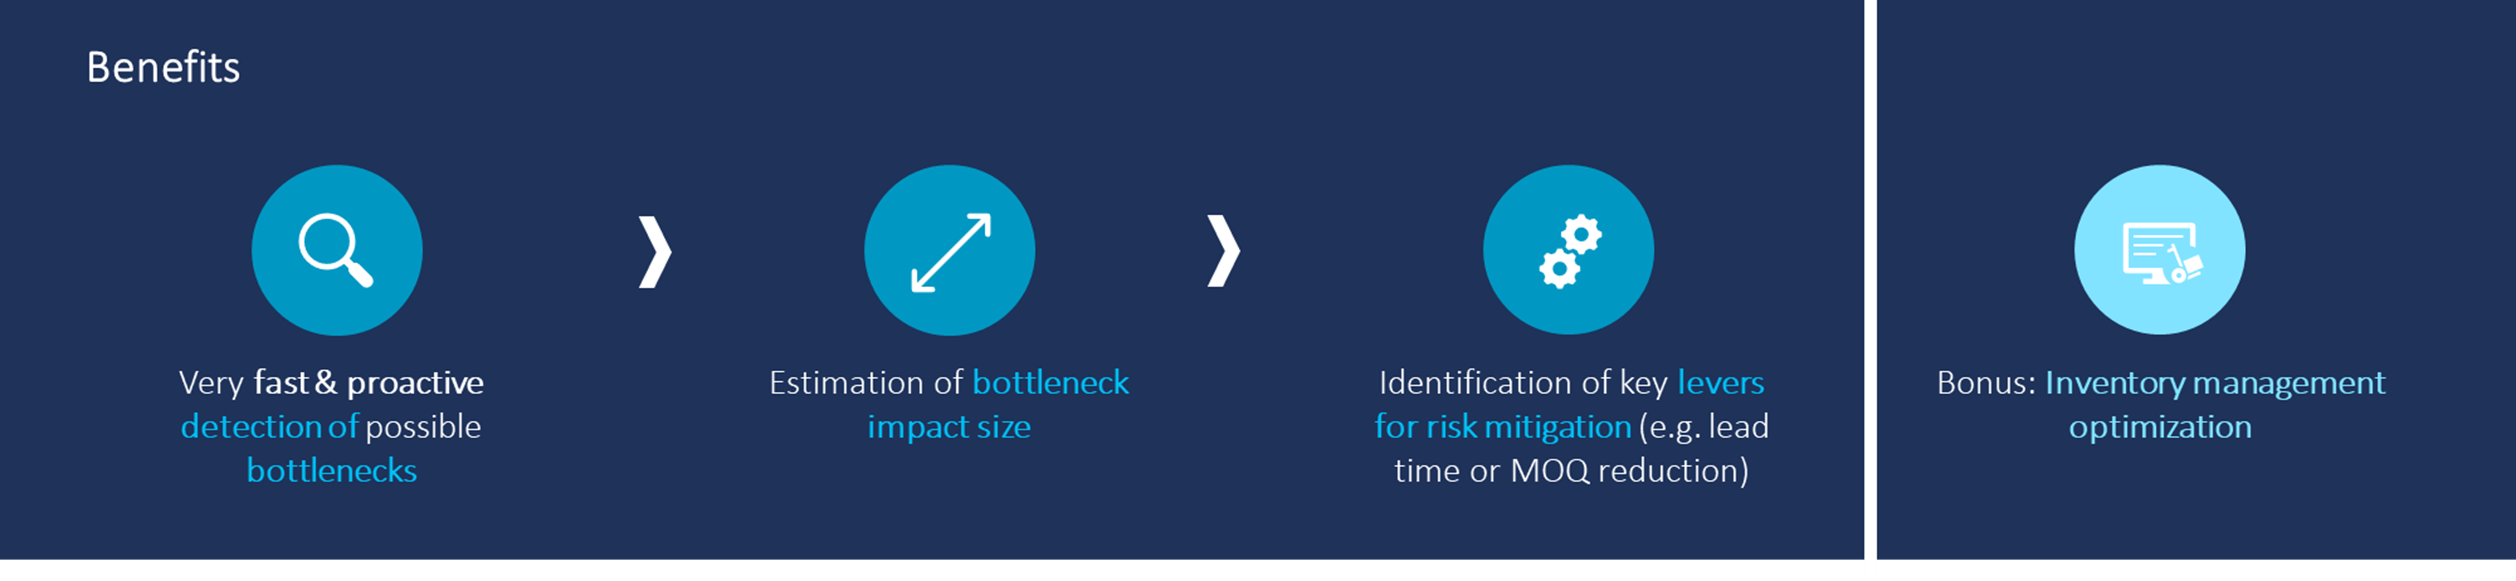
Particularly in the process industries (pharmaceuticals, chemicals, consumer goods), many products have a limited shelf life. During the course of several supply chain design projects, the COVID-19 crisis raised the question of what influence supply chain design has on obsolescence and how it can be measured. Currently, this is a question that no standard tool on the market can answer. In view of the extreme fluctuations in demand, which are predicted to continue through 2021, this is a very important issue. If one also takes into account that many products, particularly in the pharmaceutical industry, are country-specific due to labelling, package inserts and other factors, then the last decoupling stage of secondary packaging takes on great importance. Most of our customers measure the risk of obsolescence based on the age of the stock and a classification of how likely it is that demand for an x-year-old material will be lacking. For design projects, this falls short. One has to consider all existing structural obsolescences and determine how they could manifest in the future in different scenarios and footprints.
With the Obsolescence Simulator, we have created a tool that provides a simple technical basis for simulating a supply chain on the basis of historical data or demand forecasts at the batch level. This makes it possible to test different footprints. The applications for this tool extend beyond the area of supply chain design. In the future, planners will be able to quantify obsolescence risks as part of the S&OP process and include them in the process of deciding the number one plan. Stocks can be managed with regard to obsolescence risks, allowing the ordering & warehousing policy to be optimized accordingly. A sensitivity analysis supports the user in identifying the main drivers and mitigating the risks. This quickly makes it clear whether significant improvements can be made in the minimum order quantities for production or in accelerating delivery times.
We would be happy to introduce you to our tools in person or virtually. If you would like to learn more, please make an appointment for a meeting or video conference with us!
We would like to thank Dominik Hartung for his valuable contribution to this article.