
One of the most challenging questions data scientists face is how data can bring value to a specific problem. Data scientists encounter various business requests to solve problems using machine learning and AI. However, many of such problems might not be data science problems. By having the request from the business side and a dataset to explore, a data scientist should decide if the problem is solvable by data analytics or not. And if the answer is yes, what is the best way to tackle the problem.
Exploratory Data Analysis
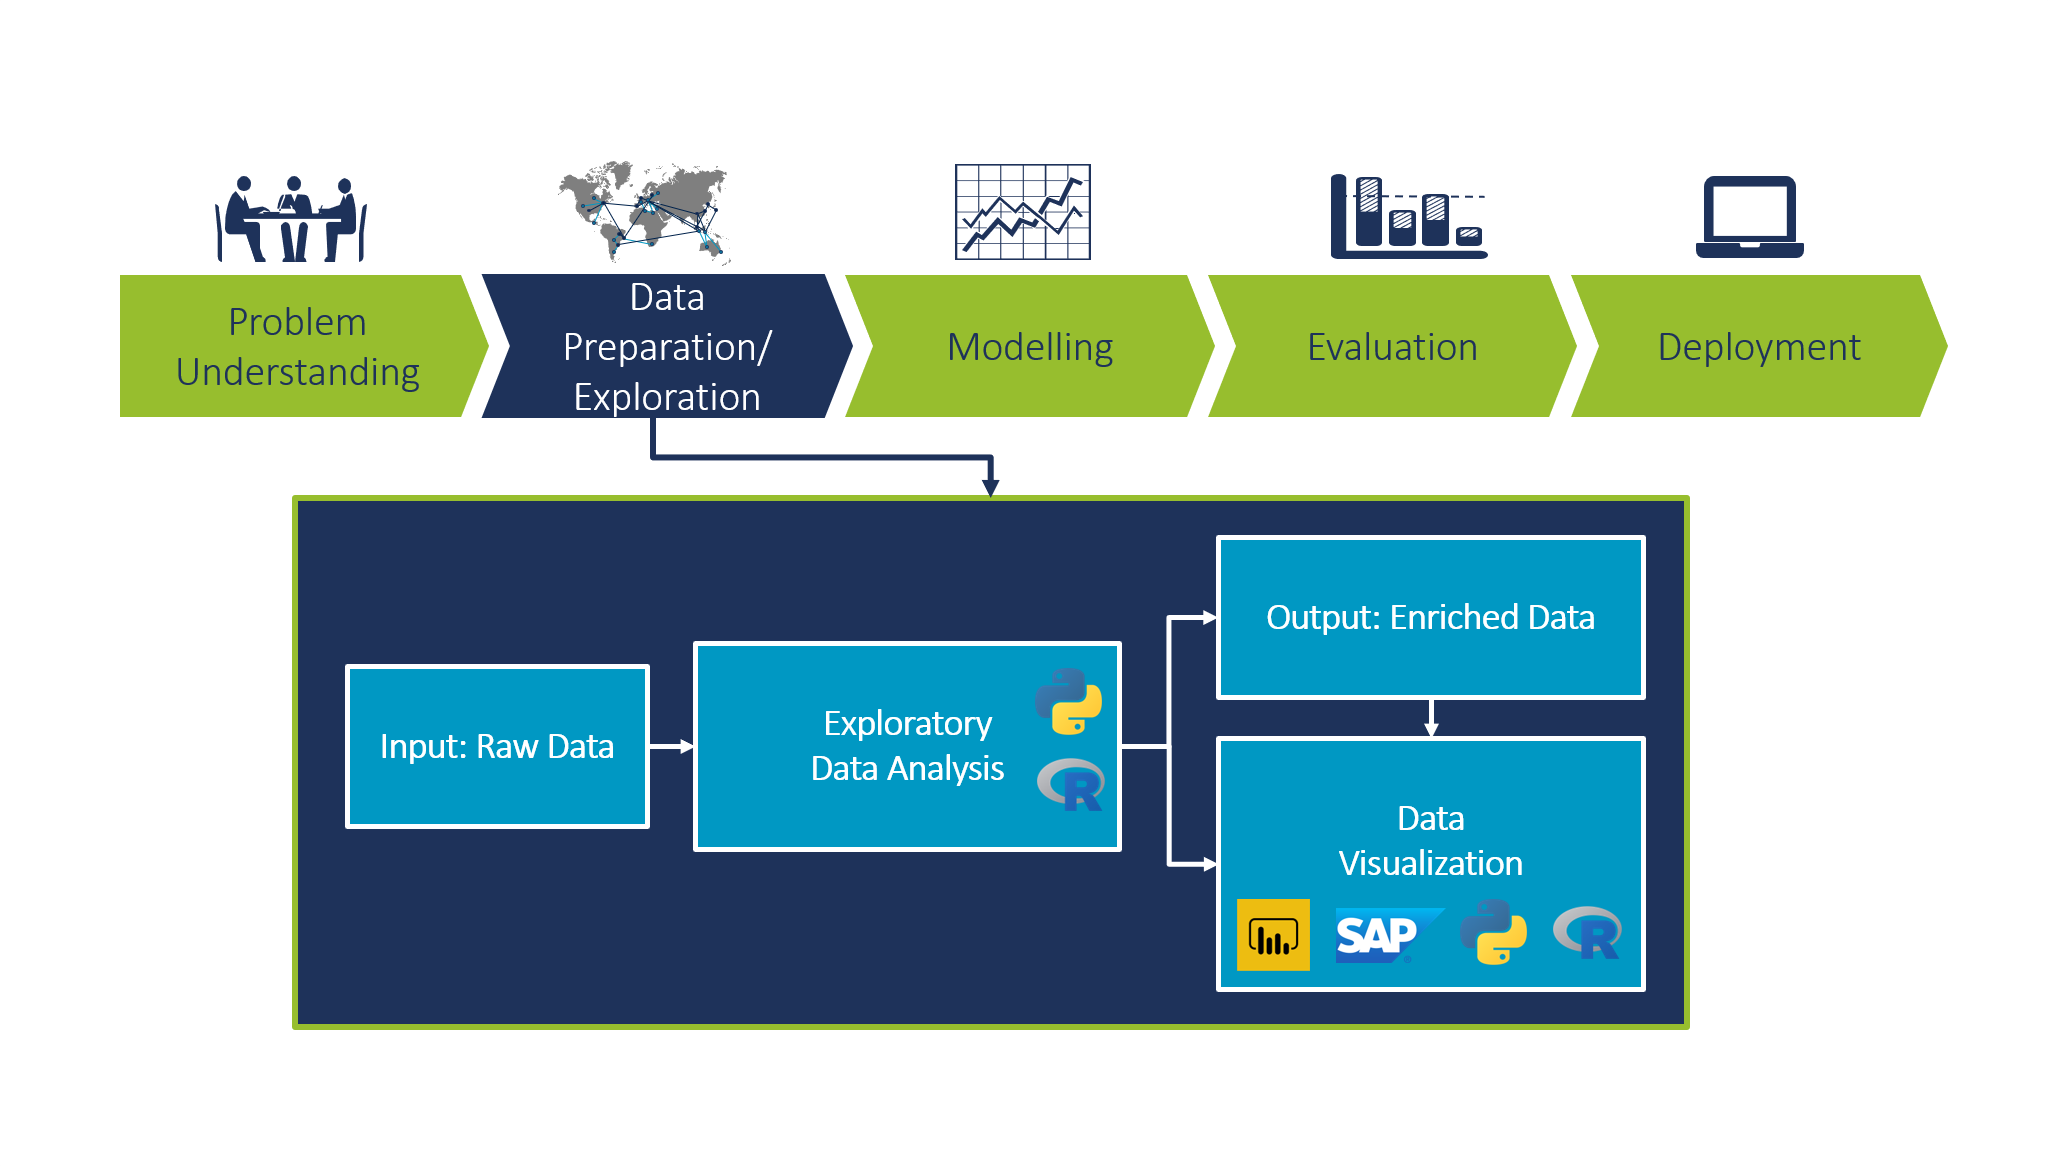
Exploratory Data Analysis (EDA) is an approach to extract the information enfolded in the data and summarize the main characteristics of the data. It is considered to be a crucial step in any data science project (in Figure 1 it is the second step after problem understanding in CRISP methodology). Most people underestimate the importance of data preparation and data exploration. EDA is essential for a well-defined and structured data science project and it should be performed before any statistical or machine learning modeling phase. In this post, we focus on how EDA is done, and which technologies do we use at Camelot for data exploration and data visualization.
Data Preparation
Data preparation is cleaning and organizing the real-world data, which is known to take up more than 80% of the time of a data scientist’s work. Real-world data or raw data is dirty, full of missing values, duplicates and in some cases wrong information. Most machine learning algorithms cannot deal with missing values; hence, data needs to be converted and cleaned. Common solutions of handling missing values would be dropping rows, linear interpolation, using mean values etc. Depending on the importance of the feature and amount of the missing values one of these solutions can be employed.
At Camelot, we mainly use Python and R (Programming languages commonly used by data scientists on their daily work) for data preparation and data pre-processing.
Data Exploration
Having a clean dataset in hand, we need to understand the data, summarize its characteristics, and visualize it.
Understanding the data is an iterative process between the data science team and the experts from the business side. It can help both sides to identify and construct important features, and later to build suitable machine learning models.
An essential part of data exploration is data transformation. Let’s clarify it by an example. Assume a forecasting problem in the field of logistics for a number of deliveries in different locations by different suppliers. One data transformation option is “filtering”. It is possible to filter one specific location, or one specific group of suppliers, and make the forecast on the filtered data to get a fast insight. Another tactic is called “aggregation”. If we have daily data, by making weekly or even monthly aggregation we can have a new data set which brings us insights to the existing seasonality and trends.
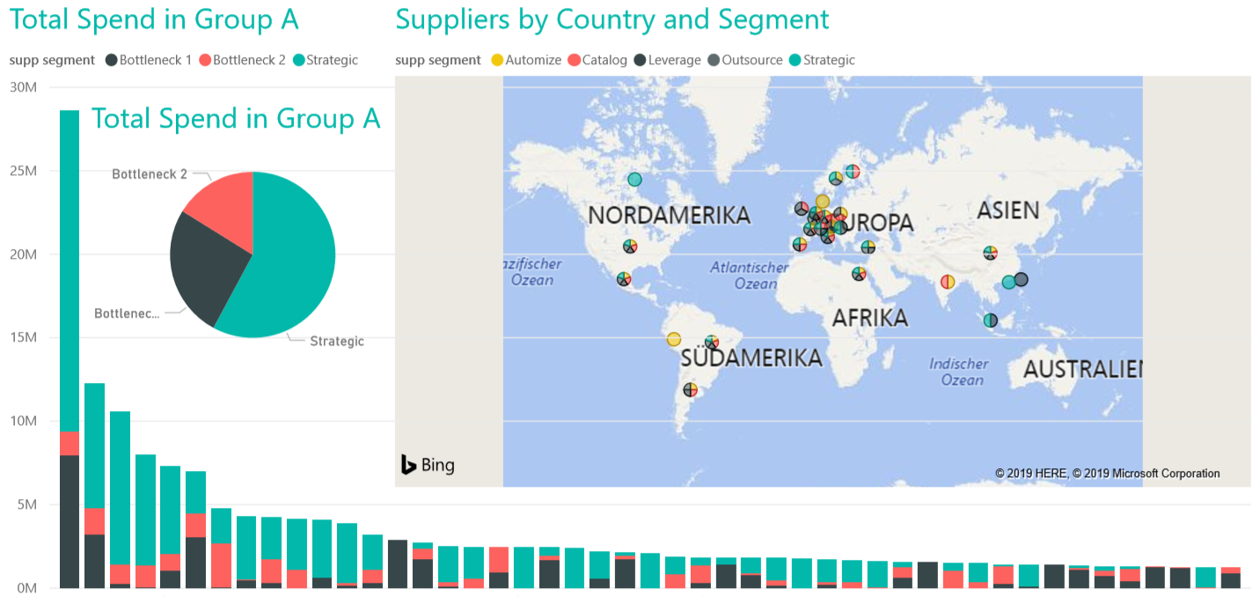
Having the enriched data, we can visualize it. Data visualization allows us to understand data quickly. It helps data scientists and business stakeholders to easily align on processes and data quality. This is an important feedback loop in the CRISP methodology towards problem understanding. From a data perspective, it will help to rapidly identify patterns, detect outliers, and decide how to proceed with the problem in hand. Python libraries such as matplotlib and seaborn are strong tools for visualization, especially for technical discussions and internal iterations to define the scope of the project. Moreover, Power BI (a business intelligence solution by Microsoft) can be employed to produce interactive dashboards for prototyping and as a proof of concept for customers. We use other important enterprise tools such as SAP Cloud Analytics to ensure enterprise quality and integration.
Some commonly used plots for EDA are:
- Histograms: to check the distribution of a specific variable
- Scatter plots: to check the dependency between two variables
- Maps: to show distribution of a variable on a regional or world map
- Feature correlation plot (heatmap): to understand the dependencies between multiple variables
- Time series plots: to identify trends and seasonality in time dependent data
Example of a Power BI dashboard is depicted in Figure 2.
After completing the EDA process, one can start the modeling phase. Modeling consists of statistical modeling and building machine learning models. Although, basic statistical analysis is already included in EDA, the complete statistical modeling is performed in the modeling phase, which can be a topic of separate blogpost.
Conclusion
In conclusion, Exploratory Data Analysis is a vital step in a data science project. The main pillars of EDA are data cleaning, data preparation, data exploration, and data visualization. There are various exploratory tools (Python and R), and enterprise applications (Power BI, SAP Cloud Analytics, Tableau, etc.) to perform EDA, each of them offering a unique set of tools.
We would like to thank Dr. Ghazzal Jabbari and Frank Kienle for their contribution to this article.